![]()
![]()


![]()


The cloud computing services are changing the way that companies and public institutions use information technologies. Cloud services are emerging as a great opportunity to reduce the time spent on infrastructure development and management. By making use of these cloud services we obtain advantages such as speed in provisioning, scalability, flexibility, cost improvements, a pay-per-use and subscription model, a better user experience and a broad portfolio of products and services.
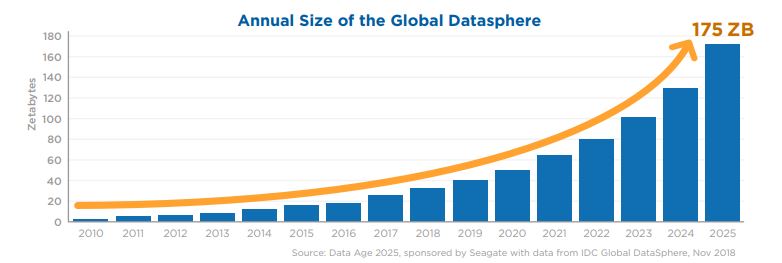
As we use information technology, the volume of data and information that is generated and shared on a personal and business level does not stop growing, where the volume of data will reach 175 zettabytes in 2025, according to a report by the consultancy IDC, which means the equivalent of 175 times the information generated in 2011. The volume of data in the world is growing exponentially. According to some estimates, 90% of the data in the world has been created in the last two years and predicted to grow of 40% per year.

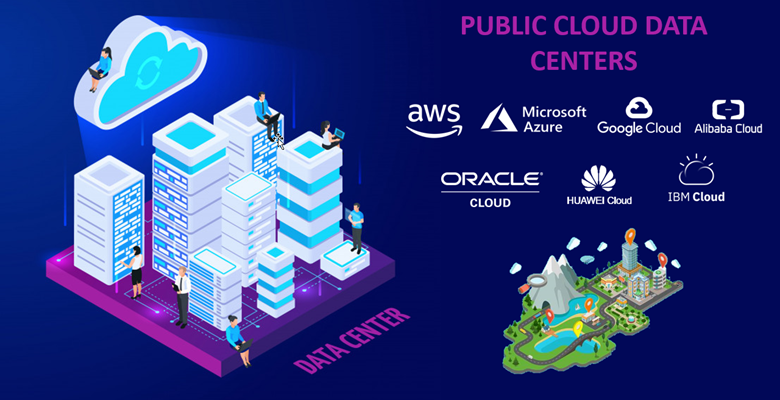
To satisfy the high demand for storage services, compute processing and immediate access to data, public cloud providers have increased their data centers in different regions of the world and their capacity to meet the needs of IT operators and satisfy the high demand from customers in the cloud.
The main public cloud service providers will continue to gaining share as most small, medium, and large businesses adopt the cloud. With the explosive growth of cloud data centers, the data center market has had to adapt to these new trends, where companies will have the opportunity to migrate their infrastructures to the cloud, create robust Artificial Intelligence (AI), Big Data, Machine Learning, IoT among others.
Based on these assumptions, i maked an investigation of the data centers currently deployed by the main public cloud providers (AWS Cloud, Microsoft Azure, Google Cloud, Alibaba Cloud, Oracle Cloud, Huawei Cloud e IBM Cloud) around the world, where through of Google Maps we can see where find located these data centers of each of these cloud providers. Additionally, we can see a summary of regions, availability zones, status, websites to measure latency and more.
Update - June 15th, 2020
 |
|
 |
 |
||||
| Regions | 26 | 48 | 34 | 27 | 38 | 12 | 11 |
| Zones / Domains | 84 | 98 | 103 | 84 | 46 | 31 | 27 |
| Info | AWS Cloud | Azure | GCP | Alibaba Cloud | Oracle Cloud | Huawei Cloud | IBM Cloud |
| Status | AWS Estatus | Azure Estatus | GCP Estatus | Alibaba Cloud Estatus | Oracle Cloud Estatus | IBM Cloud Etatus | |
| Measure your Latency | Cloud Ping | Cloud Ping | IBM Cloud Ping |
Map on Google Maps
* This map is based on the available information presented on the websites of each cloud provider.
Hope will be useful.
Best Regards,
Share:
Follow us:


